The curve steepening continued Thursday with a steady tone inside 10-years and pressure on bonds outside there forced another session of one to two basis point cuts to benchmark yield curves as U.S. Treasury yields also rose and equities were mixed.
Triple-A benchmarks have the 10-year at 0.90%-0.91% and the 30-year at 1.48%-1.50%. With the one-year muni at 0.06%, the spread between the one and 30-year is 144 basis points. The 10-year UST rose to 1.37% and the 30 to 2.01% in late trading leading municipal to UST ratios to sit at 67% in 10 years and at 73% in 30.
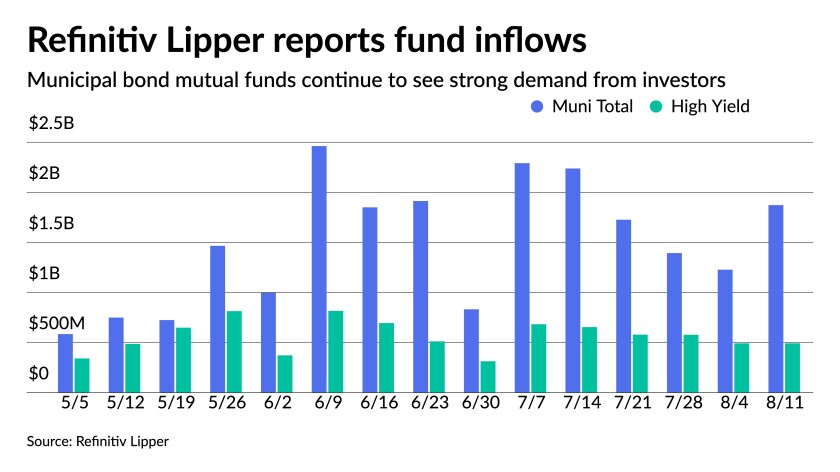
Refinitiv Lipper reported $1.87 billion of inflows into municipal bond mutual funds for the week ending August 11, up from the previous week’s $1.23 billion and the 23rd straight week of positive flows. High-yield saw $493 million of inflows.
Fund flows continue to be a strong demand component for the asset class, but investors are not simply looking for the tax-exempt income.
“My theory is that a lot of the flows into fixed income funds are not necessarily a vote of excitement about bond yields; it’s investors and advisors doing what they’re supposed to be doing by balancing their portfolios,” said Pat Luby.
“Right now we are seeing spikes in mutual funds inflows that are driven not by muni market but driven by equity market,” Luby said.
The fact that equities have done so well in 2021 is part of the reason for the flows into municipal bond mutual funds. It is not just the typical flight-to-safety move; it’s partly that advisors need to move money to keep required percentages of investments allocated correctly between stocks and bonds.
“Over the last 12 months, there is an inverse correlation between outflows out of equity funds into bond funds,” he noted.
That’s not to say that he sees fund flows going negative any time soon. They are still on pace to hit record levels. Only two years had more flows than so far this year: in 2009, the total was $70.4 billion and $93.2 billion in 2019.
So far in 2021, the total sits at nearly $62 billion, per the Investment Company Institute, with four months and change to go.
In the primary, J.P. Morgan Securities LLC. priced for the Triborough Bridge and Tunnel Authority $357.85 million of MTA Bridges and Tunnels payroll mobility tax senior lien bonds: 5s of 2036 at 1.35%, 5s of 2041 at 1.54%, 5s of 2046 at 1.69%, 5s of 2051 at 1.73%, 4s of 2046 at 1.98%, callable in 2031, and 5s of 2056 at 1.63%, callable 2028.
BofA Securities priced for the City of Lubbock, Texas (A1/A+/A+/) $267.265 million of electric light and power system revenue bonds: 5s of 2022 at 0.10%, 5s of 2026 at 0.49%, 5s of 2031 at 1.18%, 4s of 2036 at 1.64%, 4s of 2041 at 1.82%, 4s of 2046 at 2.00% and 4s of 2051 at 2.06%.
Goldman Sachs & Co. LLC priced for the Windy Gap Firming Project Water Activity Enterprise, Colorado (Aa2/AA//) $170.685 million of senior revenue bonds: 5s of 2026 at 0.42%, 5s of 2031 at 1.05%, 5s of 2036 at 1.40%, 4s of 2041 at 1.73%, 5s of 2046 at 1.74% and 5s of 2051 at 1.83%.
Secondary trading and scales
New York City 5s of 2022 traded at 0.07%. California 5s of 2023 at 0.10%. Fairfax County, Virginia 5s of 2024 at 0.17%. Wisconsin 5s of 2025 at 0.26% versus 0.24% Tuesday. Gwinnett County, Georgia 5s of 2025 at 0.27%. Connecticut special tax 5s of 2026 at 0.43%-0.42%.
California 5s of 2028 at 0.65%. Montgomery County, Maryland 4 of 2029 at 0.75%.
Virginia Beach 5s of 2031 at 0.95% versus 0.85% original.
Arlington County, Virginia 5s of 2034 at 1.10%-1.09% versus 1.08%-1.07% Wednesday.
Univ. of NC Chapel Hill 5s of 2038 at 1.24%.
California 5s of 2046 at 1.53%-1.49%. LA DWP 5s of 2048 at 1.55%-1.44% versus 1.50%-1.49% Wednesday.
Refinitiv MMD saw levels steady at 0.06% in 2022 and at 0.08% in 2023. The yield on the 10-year steady at 0.88% while the yield on the 30-year rose two to 1.50%.
ICE municipal yield curve saw steady at 0.06% in 2022 and at 0.08% in 2023. The 10-year maturity was at 0.91% and the 30-year yield rose two to 1.48%.
The IHS Markit municipal analytics curve saw the one-year steady at 0.07% and the two-year at 0.08%, with the 10-year steady at 0.90%, and the 30-year yield up two to 1.48%.
Bloomberg BVAL saw levels at 0.06% in 2022 and 0.06% in 2023, while the 10-year rose one to 0.90% and the 30-year up two to 1.48%.
Treasuries rose while equities were mixed. The 10-year Treasury was yielding 1.362% and the 30-year Treasury was yielding 2.005% in late trading. The Dow Jones Industrial Average gained 13 points or 0.038%, the S&P 500 rose 0.31% while the Nasdaq gained 0.37%.
Refinitiv Lipper reports $1.9B inflow
In the week ended Aug. 11, weekly reporting tax-exempt mutual funds saw $1.873 billion of inflows, according to Refinitiv Lipper. It followed an inflow of $1.228 billion in the previous week.
Exchange-traded muni funds reported inflows of $160.350 million, after inflows of $121.931 million in the previous week. Ex-ETFs, muni funds saw inflows of $1.712 billion after inflows of $1.106 billion in the prior week.
The four-week moving average remained positive at $1.555 billion, after being in the green at $1.647 billion in the previous week.
Long-term muni bond funds had inflows of $1.127 billion in the latest week after inflows of $647.952 million in the previous week. Intermediate-term funds had inflows of $287.466 million after inflows of $119.809 million in the prior week.
National funds had inflows of $1.689 billion after inflows of $1.152 billion while high-yield muni funds reported inflows of $492.501 million in the latest week, after inflows of $492.181 million the previous week.
Economic indicators
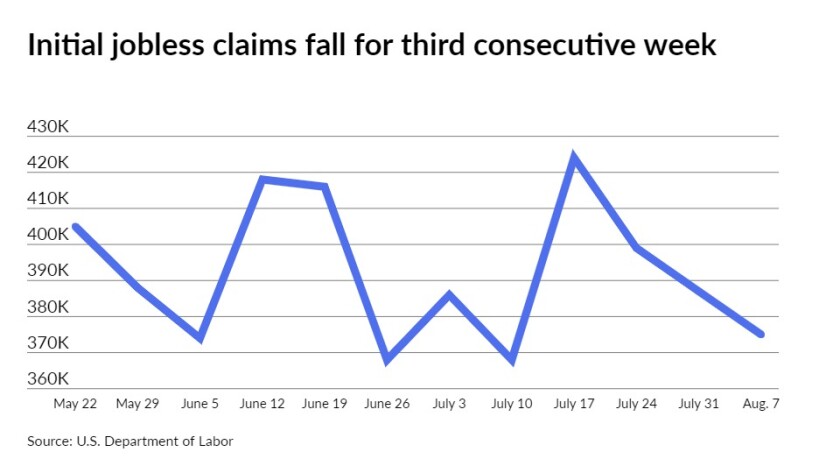
Initial jobless claims fell to 375,000 in the week ended Aug. 7 on a seasonally adjusted basis, from an upwardly revised 387,000 the week before, first reported as 385,000 claims.
Economists polled by IFR Markets estimated 373,000 claims in the week.
Continuing claims decreased to 2.866 million in the week ended July 31, from an upwardly revised 2.980 million in the prior week, initially reported as 2.930 million.

This is the lowest level for insured unemployment since March 14, 2020, when it was 1.770 million.
IFR anticipated 3.013 million claims in the week.
“Welcome improvement is seen with the new jobless claims numbers, essentially in line with expectations — of course, new claims reflect recent job loss, rather than the pace of hiring as such,” according to Mark Hamrick, Bankrate’s senior economic analyst. “The newly unemployed who are inclined to work should face generally positive prospects, an employment safety net, so to speak.”
He added that other indications of “solid improvement” in the job market, including steady hiring and a lower unemployment rate, but the Delta variant “could weigh on activity” through the rest of the year.
“On the downbeat side of the ledger, restaurant reservations and airline travel appear to be seeing some impacts from the surge in the Delta variant, which could weigh on economic activity here in the second half of the year,” Hamrick said. “These impacts could be quickly reversed if we see a substantial easing in the case numbers.”
Also released Thursday, the producer price index gained 1.0% in July, after an unrevised gain of 1.0% in June and the core also grew 1.0%, following an unrevised 1.0% climb in June. Year-over-year PPI rose 7.8% and the core grew 7.5%.
Economists expected the headline number to grow 0.6% and the core to increase 0.5% in the month and 7.4% and 5.6% for the annual growth, respectively.
“The PPI for intermediate demand is accelerating even more rapidly, suggesting that the pipeline for inflation is building,” said Berenberg chief economist for the U.S., Americas and Asia Mickey Levy. “If aggregate demand remains strong, as we have been forecasting, then businesses will have flexibility to raise product prices along their supply chains and to consumers.”
He added that the “acceleration” of the PPI and high CPI “are not surprising” and consistent with “a wide array of anecdotal evidence.”
“Pressures on production costs will remain, as businesses must raise production to meet strong demand and replenish depleted inventories while dealing with supply bottlenecks and labor supply shortages,” Levy said, noting that “unprecedented” monetary and fiscal stimulus are expected to generate sustained strong growth in aggregate demand.
“Some of the price increases reflect supply bottlenecks; however, more and more, the mounting inflation pressures at the producer and consumer levels are taking on characteristics of traditional cyclical inflation generated by excess stimulus rather than temporary blips that will conveniently dissipate,” he said.
Chip Barnett contributed to this report.
