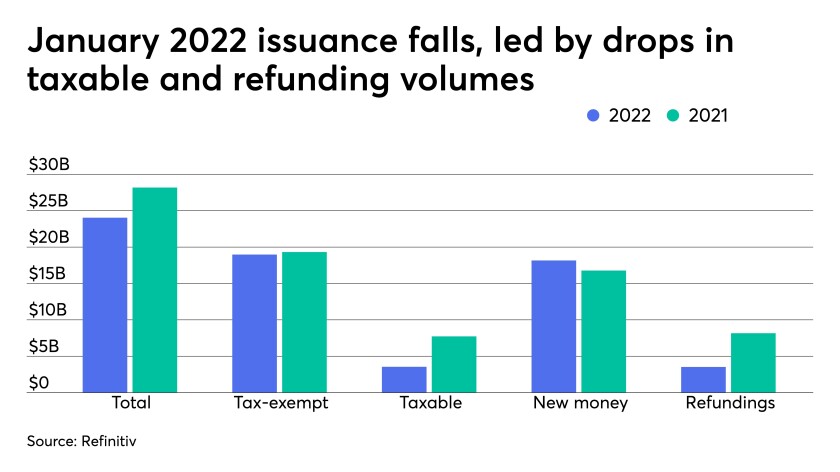
January municipal bond issuance declined 14.7% year-over-year led by a steep drop in taxable and refunding volumes amid extreme volatility and a rising-rate environment.
Total January volume was $24.04 billion in 601 deals versus $28.18 billion in 801 issues a year earlier.
New-money issuance was up 8.3% to $18.164 billion in 444 transactions from $16.776 billion a year prior while refunding volume decreased 56.8% to $3.53 billion from $8.165 billion in 2021.
Tax-exempt issuance was down 1.8% to $18.973 billion in 499 issues from $19.319 billion in 621 issues in 2021.
Taxable issuance totaled a mere $3.552 billion in 96 issues, down 54% from $7.73 billion in 174 issues a year ago. Alternative minimum tax insurance rose to $1.515 billion, up 34% from $1.131 billion.
January is typically a slow supply month, but this year issuance was especially light due to market volatility and the rapid rise of municipal and U.S. Treasury rates.
Jeffrey Lipton, managing director of municipal credit at Oppenheimer & Co., said the rise in interest rates will guide issuer sentiment in the coming months.
Starting in March, many analysts predict the Federal Reserve will implement four to five rate hikes this year, though some analysts, such as BofA Securities, predict as many as seven rate hikes.
This, in turn, could impact taxable volume in 2022 should rates rise faster than anticipated, as issuers shelve a number of their taxable advanced refunding issuances when the “refunding math” no longer makes sense, pushing taxable issuance below the projected 20% of total issuance for the overall year, Lipton said. As of January, taxable issuance is at 14.8% of all issuance.
“Even though we’re seeing a rise in muni rates, issuers don’t always have that luxury of entering the market at some most favorable times. There are enough occasions where issuers have to access the market,” Lipton said.
“If you’re an issuer and you haven’t received any stimulus funding yet and you’re running with a very tight budgetary situation, you may need to access the market, even though there’s a great deal of volatility with interest rates rising at an accelerated pace,” he said.
But the slowing of taxable supply could give way to tax-exempt issuance picking up, although a lot will depend on market conditions, Lipton said.
Tom Kozlik, head of strategy and credit at HilltopSecurities, also noted it was unsurprising for January’s issuance to be under average because issuance from the fall was plentiful.
The first two weeks of January was very light but the calendar began to build as the month finished. February’s calendar also seems to be building as well, Kozlik noted.
For February, BofA Securities strategists predict issuance of around $37 billion, though volume likely will come in lighter again if current conditions persist. Redemption volume will also be higher in February, with $34.2 billion in principal and $13 billion in coupon, for a total of $47.2 billion. Much of the redemption money in January — $24.5 billion in principal and nearly $13 billion in coupon payments — likely has not been implemented, they said.
Kozlik said for 2022 to be another banner year for issuance — like 2020’s $484-billion-plus record and 2021’s slightly less, but still impressive $475.3 billion — issuance would need to be above average for every other month.
“So, statistically it could be hard unless the difference in January is made up in other months,” Kozlik said. “A record year looks less even likely considering that many economists have already revised their GDP forecasts downward.”
“GDP is still expected to be solid this year, and state and local government credit remains strong, so I think that the biggest risk to getting a record year remains labor market questions or supply constraints,” he continued.
For 2022, issuance predictions range from $420 billion to as high as $550 billion. Oppenheimer’s projections fall around $460 billion and would have been higher if not for the exclusion of a new version of taxable, direct-pay bonds and the tax-exempt advance refundings, Lipton said.
However, Lipton said the passed Infrastructure Investment and Jobs Act could lift muni issuance to some extent in 2022 and beyond.
“There’s critical infrastructure that needs to be addressed. We’re going to see more [public-private partnership] issuers,” Lipton said.
“We’re likely to see sort of a continuation with that. The municipal bond market loves infrastructure programs, because it’s a way for municipal issuers to leverage off of federal dollars. So I would expect to see additional issuance this year and beyond with respect to critically needed infrastructure programs,” he added.
However, Kozlik doesn’t believe the $1.1 trillion bipartisan infrastructure bill — which includes the IIJA’s $550 billion of direct federal funding — will incentivize new-money municipal issuance.
“Maybe here and there could be projects, but the overall number was not all that large, and the spending was not focused on activity that translated to a potential surge or even meaningful increase in municipal issuance,” he said.
Instead, Kozlik believes the bigger influence for issuance will result from the significant federal relief courtesy of the 2021 American Rescue Plan Act.
Issuance details:
Issuance of revenue bonds decreased 21.6% to $12.817 billion from $16.346 million billion in January 2021, and general obligation bond sales dropped 5.2% to $11.223 billion from $11.835 billion in 2021.
Negotiated deal volume was down 12.2% to $18.83 billion from $21.449 billion a year prior. Competitive sales also decreased to $5.102 billion, or 0.5% from $5.13 billion in 2021.
Deals wrapped by bond insurance were relatively the same in par value, with $2.053 billion in 99 deals from $2.052 billion in 142 deals a year prior.

Bank-qualified issuance dropped to $748.1 million 178 deals from $1.064 billion in 249 deals in 2020, a 29.7% decrease.
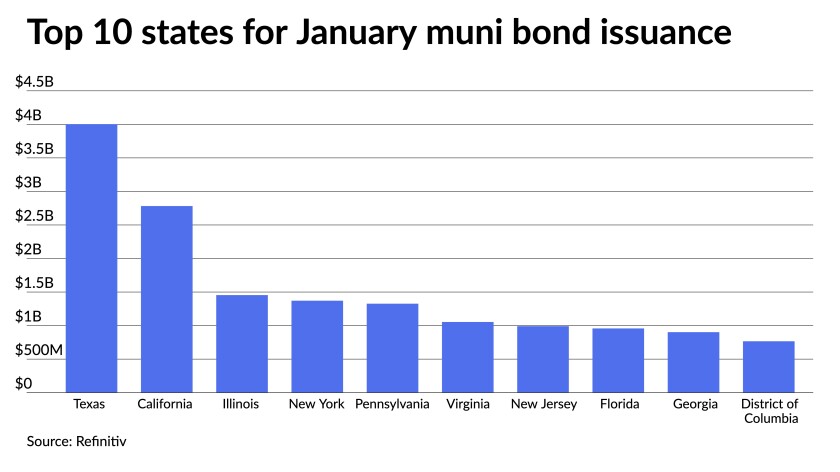
In the states, Texas overtook California.
Issuers in the Lone Star State accounted for $4.003 billion, up 0.7% year-over-year. California was second with $2.782 billion, down 48.2%. Illinois was third with $1.454 billion, down 5.2%, New York is fourth with $1.371 billion, down 37.8%, and Pennsylvania rounds out the top five with $1.326 billion, a 1.4% increase from 2021.
The rest of the top 10 are: Virginia with $1.054 billion, up 52.5%; New Jersey with $991.1 million, down 51.4%; Florida with $957.5 million, down 11%; Georgia at $901.9 million, up 343.2%; and the District of Columbia with $766 million, up 2,616.3%.
